The numbers that matter
Sales, pageviews, signups, average session, return rate.
Open Stats. Pick today, 7 days, or a custom range. See if last night’s push moved pageviews, sales, or session time.
Sales, pageviews, signups, average session, return rate.
Today, 7 days, 30 days, a custom range, YTD, or all time.
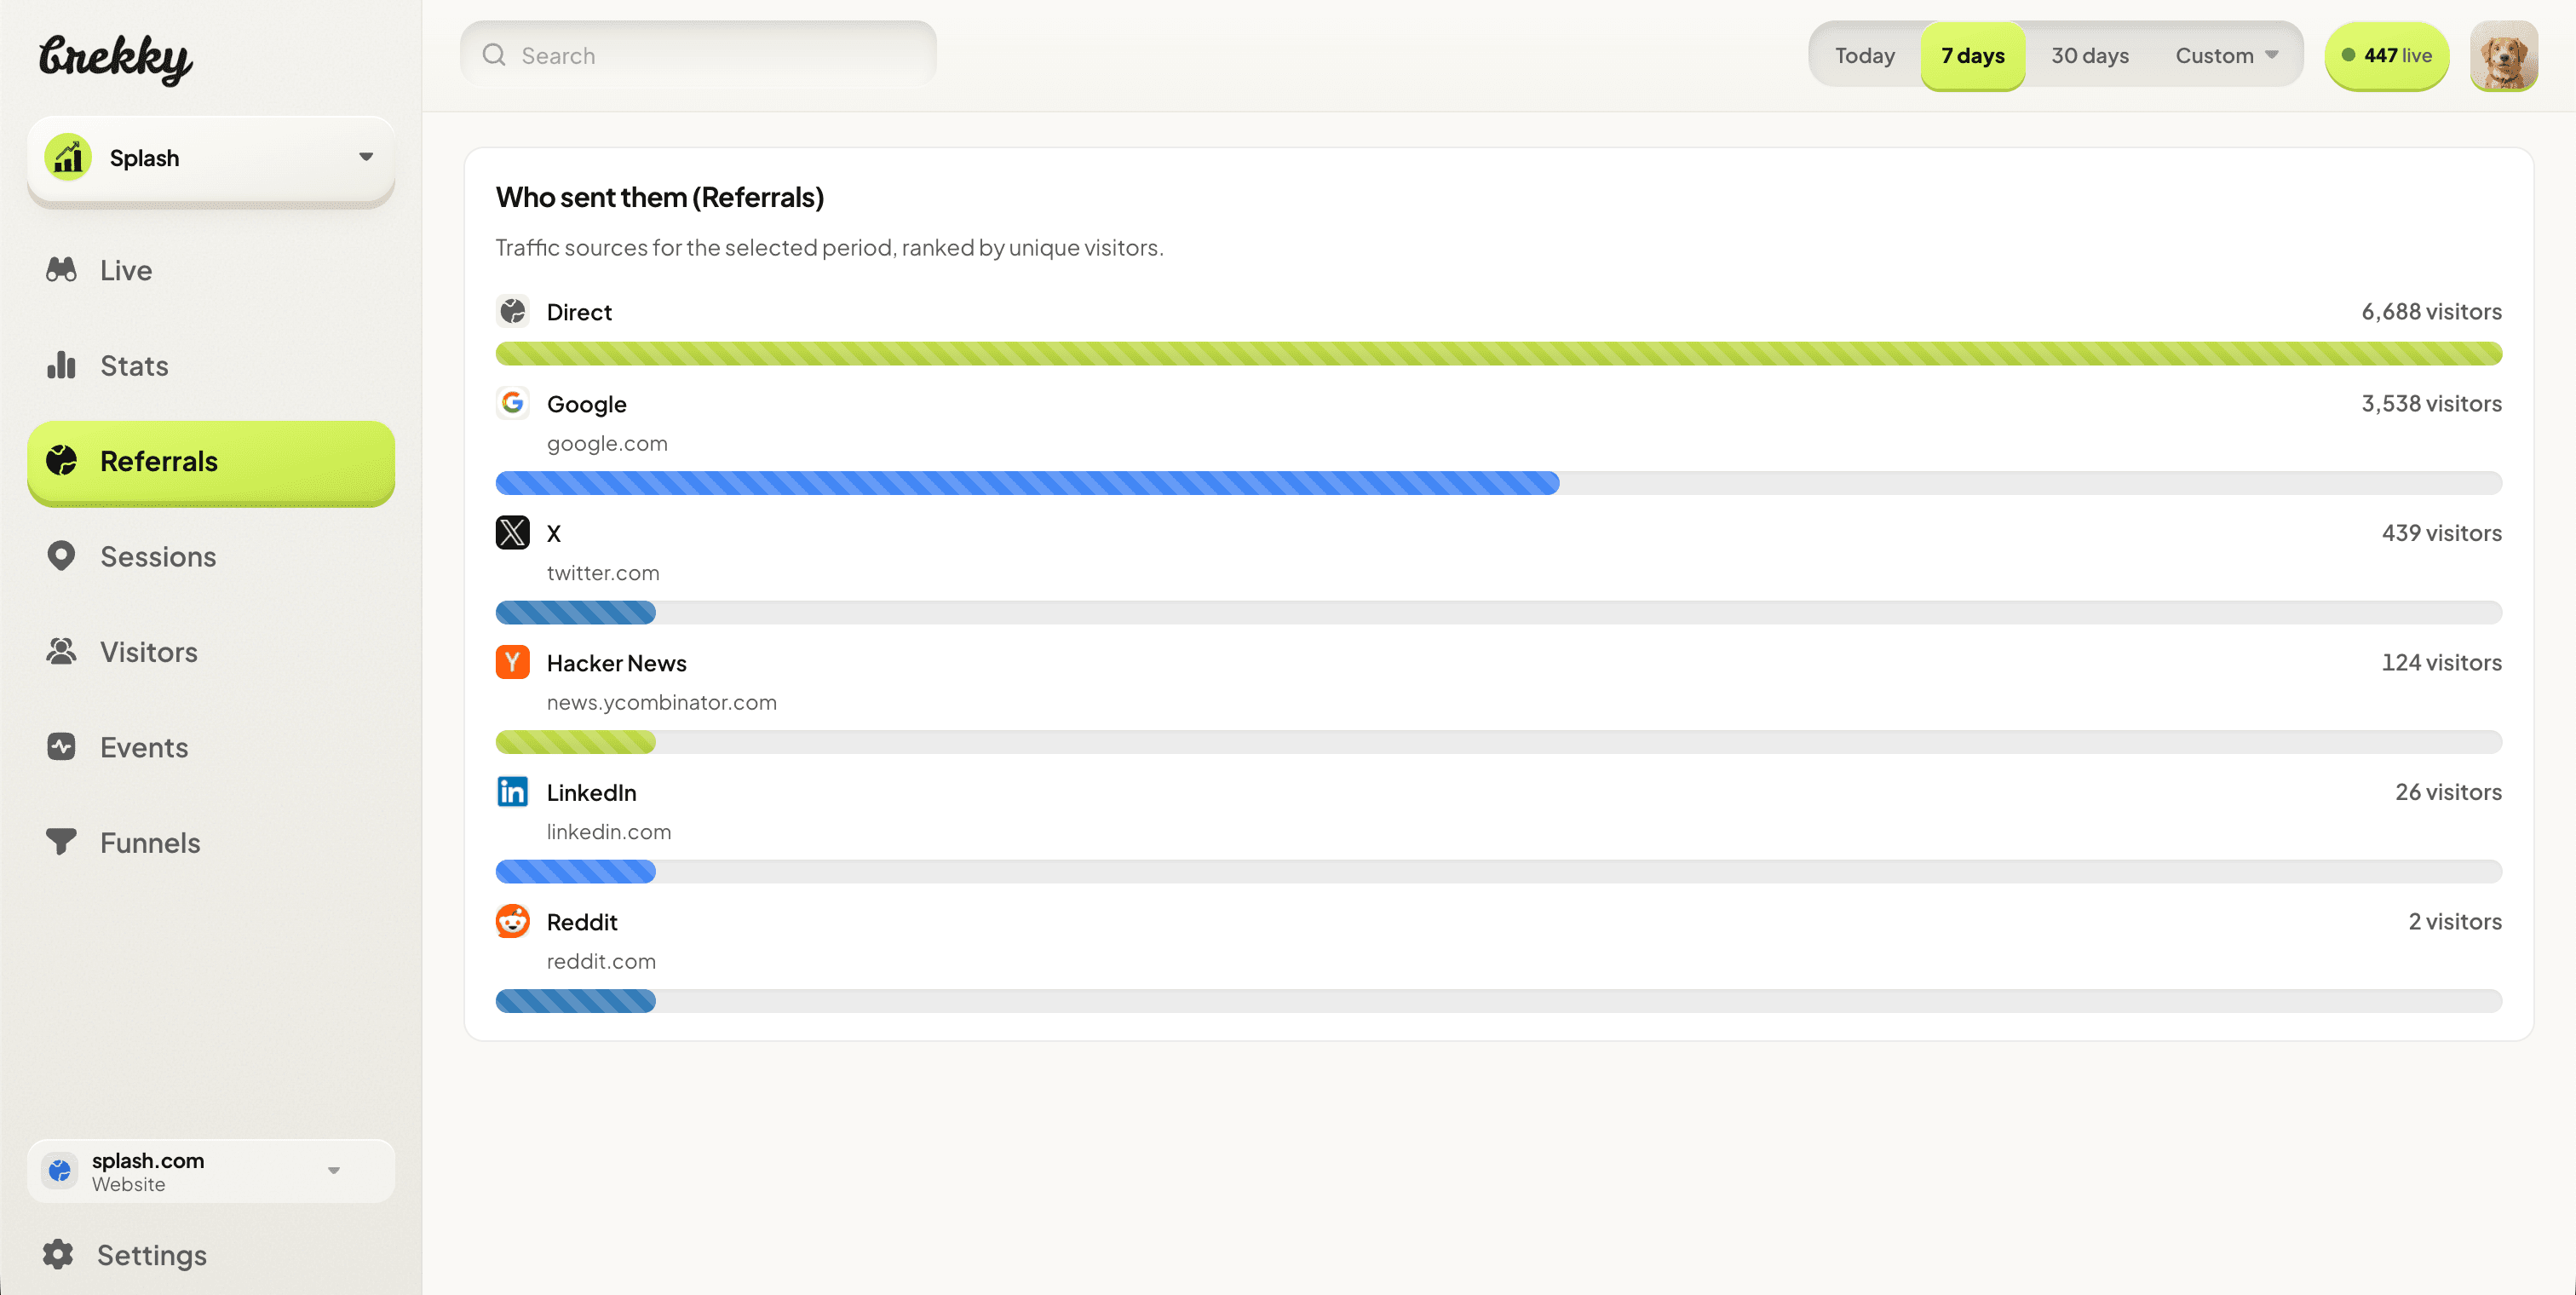
Top pages, devices they used, who sent them.
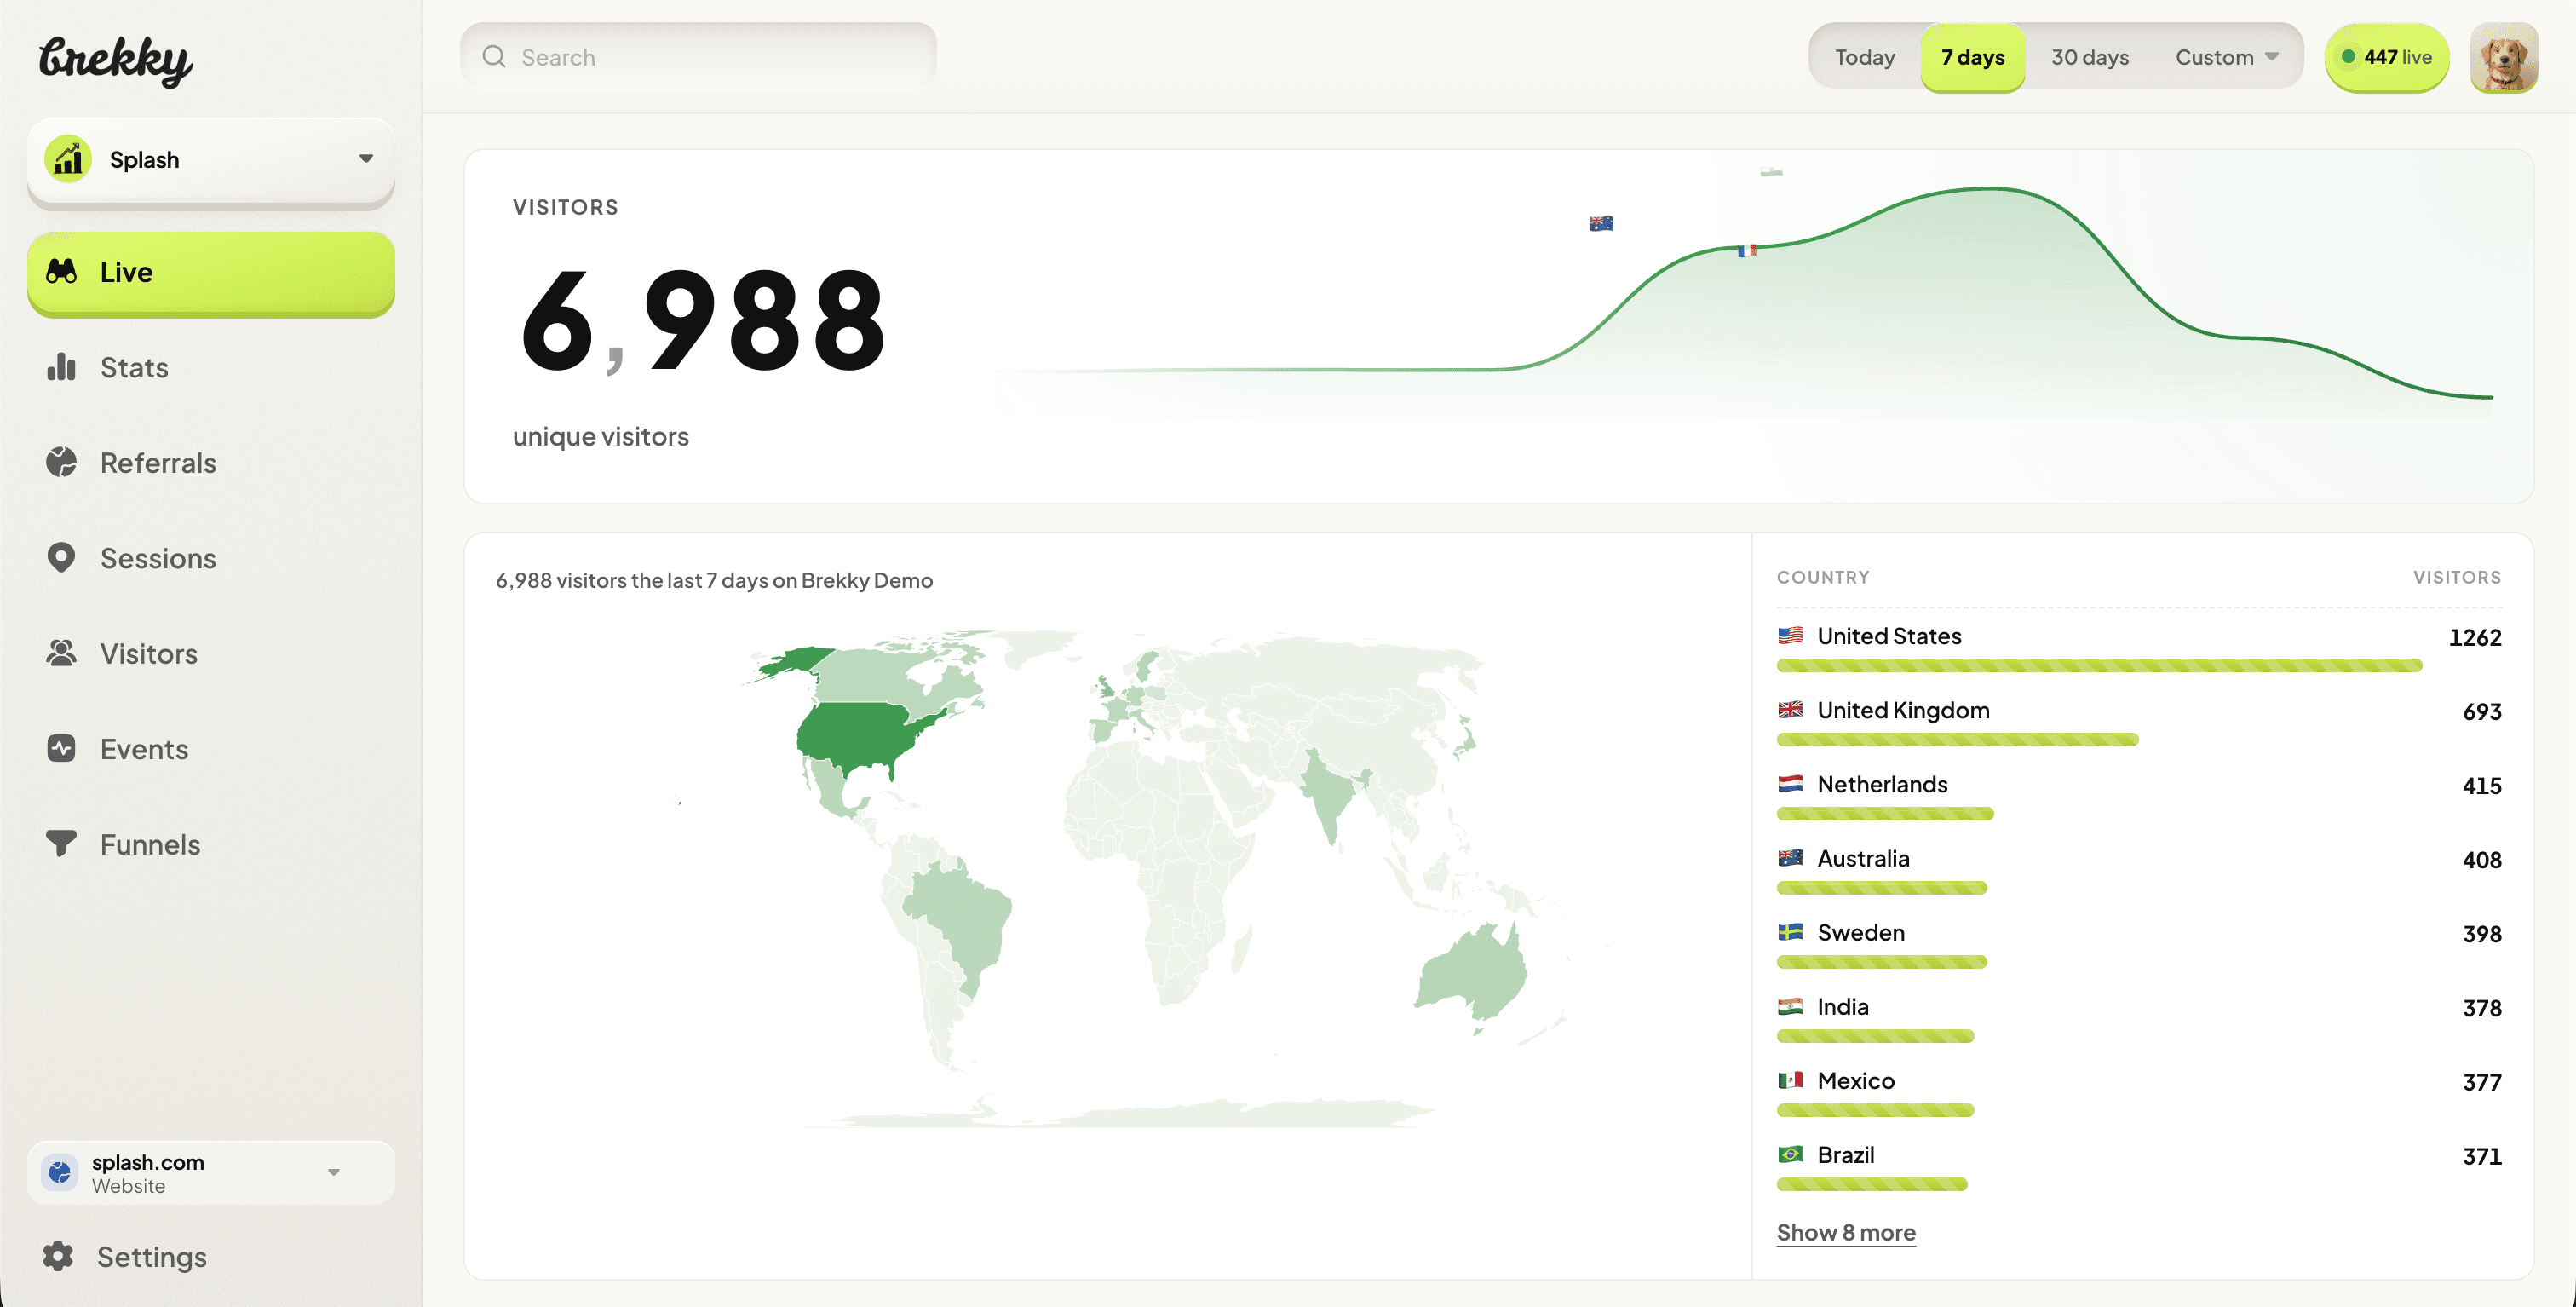
Traffic over the selected range. Web leans on pages. Mobile leans on screens and app events.
Totals come from checkout_completed and purchase events with amount and currency. Payments stay in their own currency. Pick one if you take more than one.
Top pages, devices they used, and who sent them. Same date range as the chart.